Task 2: Machine Learning automatic resolution
Use some R packages for machine learning to predict SDG indicators
3. Task 3: Structuring data to train a learning method
Learning methods require information to be structured into elements/observations/cases/instances, and each observation must have characteristics/indicators/properties that are measured. You want to know the classification (or the estimation of an indicator) of an element based on its features. The variable you want to know can be binary, discrete or real. We will focus our examples on binary variables, as this is the purest case of learning. For the sake of ease and affinity to statistical methods, we can call independent variables the characteristics/indicators/properties, the dependent variable what we want to know, and observations the elements/observations/cases/instances.
For supervised learning methods to work, there must be past observations with classifications, so all the independent variables and the value of the dependent variable must be known, and a given method can be trained to classify unseen observations. This information can be in the form of an array, with the independent variables in columns and the observations in rows.To load into R, we can place the data in a .csv file and read it (data.csv):
Action: | Expected: |
> setwd("set working folder") | 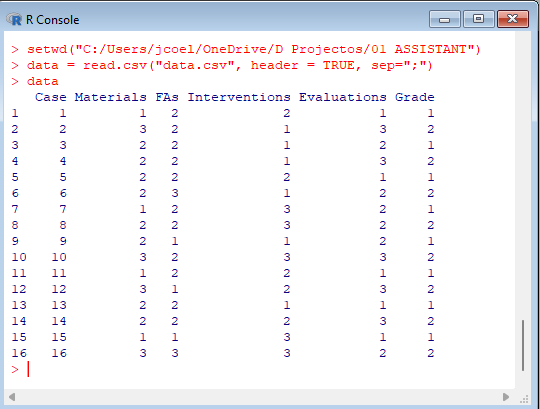 |
|---|
Action: | Expected: |
> data[,2:5] > data[,6] | 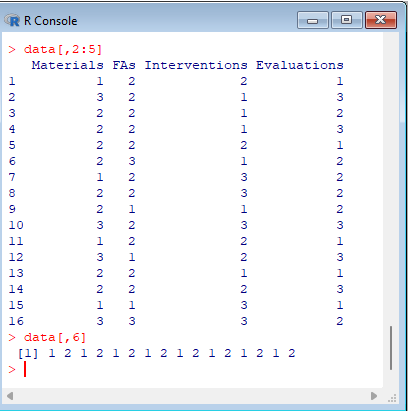 |
|---|